
In the last post we discussed some of the significant hurdles involved in converting a substantial amount of our electrical grid to renewable electricity. But now let's get down to the nitty gritty. In this post we will start with a typical electrical demand curve that we see in the Fall / Winter / Spring (which from here on out I will just refer to as "Winter"), and then we'll add more and more Solar until we break the grid. And then we'll discuss the various strategies to fix it! OK so first a little reminder of what the Winter demand curve looks like:

If you remember back from "Basic Grid Overview Part Three" there are two "humps" of demand, the first occurring in the morning, and the second occurring in the evening. Unfortunately for the grid operators, solar electricity output peaks at noon, which is during a lull in demand. As we will soon see, this makes things pretty stressful for our grid operators.
First though an easy one - let's look at 1% Solar Generation:

This graph has 1% Solar Generation in Winter with 15% Nuclear, 50% Coal, and 25% Natural Gas (the remaining 10% is from Natural Gas "Peaker" plants, but demand isn't high enough to require this type of power plant during fall /winter / spring). Note that I'm bringing back the graph paper and the dots! I want you to keep the power of squishing in mind from "Basic Grid Overview Interlude (Part 2.5)" so I'm going to represent the amount of Solar power made with green dots on each graph. In this case, you can see that the grid operator has little trouble accommodating the 1% Solar. The operator turns down Natural Gas to its 25% minimum and turns down Coal a bit too. Easy. Next!

This graph has 5% Solar Generation in Winter with 15% Nuclear, 50% Coal, and 25% Natural Gas. Once again the grid operator doesn't have too much trouble. They turn Natural Gas down to it's minimum and they turn down Coal a bunch too, but because they don't have to turn coal down past its minimum everything is cool. But now let's up the ante.
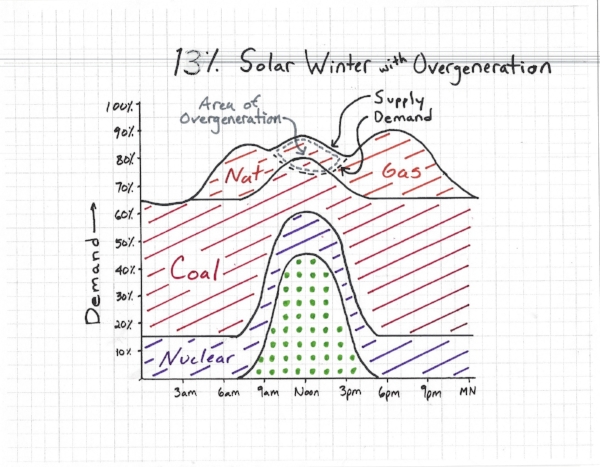
This graph has 13% Solar in Winter with 15% Nuclear, 50% Coal, and 25% Natural Gas. As promised, we have broken the grid! Because at noontime there is so much Solar power coming into the grid (count those green dots - I promise they are exactly the same as from before!), it throws the whole grid into havoc. Natural Gas is turned down to its 25% minimum and Coal is turned down to its 40% minimum. But that isn't enough! As we saw in "Basic Grid Overview Part 3" there is more power being supplied to the grid than power being used, a condition called "overgeneration." On the graph above see how supply (the solid black line) separates from demand (the dashed black line). As discussed previously, this would cause a power outage. Therefore no grid operator worth their salt would let this happen. So what are the options? Let's check them out:

This graph has %13 Solar in Winter with 15% Nuclear, 50% Coal, and 25% Natural Gas. Oops that 13% is wrong though! We don't have 46 green dots anymore, we only have 36. Therefore it would be more accurate to say we have 10% Solar. OK so what has happened here? Quite simply the grid operator has turned down the Solar just enough so that neither Natural Gas nor Coal have to go below their minimums (25% and 40% respectively). The area outlined with gray dashed lines labelled "Dots Missing" is the amount by which the grid operator turned down the Solar plant. The act of turning down a Solar or Wind plant is referred to as "curtailment" in the industry lingo. Obviously this is a pretty simple solution to our overgeneration conundrum, but not a very satisfying one. We had the ability to generate 46 green dots of Solar electricity but we only used 36 of them (a decrease of 22%). If grid operators just stuck with this strategy all the time, you can see that (in our example) Solar's contribution to the grid would essentially be capped at 10%! In the graph above, 22% of our Solar power goes to waste. You can see that with curtailment there is no point in adding any more Solar power to the grid because it will just go to waste. Even if there were a ton more Solar, it wouldn't do any good because anything above 10% just gets curtailed. This is something that we'll get more into later, but note that 10% is specific to this example - some places can handle more. OK so this whole curtailment thing kind of stinks, so what other options do we have?

This graph has Solar 13% in Winter with 15% Nuclear, 50% Coal, and 25% Natural Gas. As you can see things are getting a little crazy here! And this is where our grid operators start to really earn their money. So what is happening? As we've discussed several times Natural Gas plants can only be turned down to a 25% minimum and Coal down to 40%. But in the graph above you see Coal is turned down way lower than 40% - so what is happening?
First we need to take a little step back and review how a Coal plant actually works. The first question you might have is why can't a Coal plant turn down past 40%? The answer is pretty involved, but let's try a quick overview. To make electricity, coal is burned and the heat is used to boil water to make steam and then heat up that steam really really hot (way hotter than what you do on your stove). This occurs in the "Boiler." That super hot steam exerts a lot of pressure because it is so hot, and it exits the boiler through some tubes and heads into the electrical turbine. The turbine has a bunch of blades (like a pinwheel) and the steam rushing out of the tubes push against the blades, making them spin, and then (with some magnets and other stuff) makes electricity! As the super hot steam goes through the turbine, it is expanding (it is actually the expanding of the steam that is doing the pushing on the turbine blades). As the steam expands, it cools. But they don't let the steam cool enough to become water again. Why not? Because if they did that then the turbine blades would become covered in water, making them much heavier and harder to push, and the amount of electricity being made would go way down. So. The coal plant cannot turn down past 40% because turning it down more than this would not keep the steam hot enough to not condense into water as it pushes / expands past the turbine blades. Make sense? I realize that was a big one. But we're about to go even further!
The next thing you need to know about a coal plant is that there is not just one boiler and one turbine. A typical Coal plant might have 4 separate boilers each with their own turbines. One boiler / turbine "team" is referred to as a "block." I have assumed the graph above that this Coal plant is really made up of 4 separate coal blocks, each of which can be controlled independently of one another. In the graph above we have the grid operator turning 3 of the 4 Coal blocks completely off. With only 1 of the 4 blocks still running, the Coal plant can turn down way lower, thereby accommodating the Solar electricity. OK so that sounds easy enough right? The problem is that this process is anything but easy. Disconnecting a coal block from the grid is known as taking the block "offline." The process of taking it offline and then turning it back on and reconnecting to the grid is known as "cycling." As I mentioned the temperatures inside a steam power plant are very very hot - sometimes even reaching 1000 degrees F (530 C) and the pressures are incredible too (up to 3500 psi). At these tremendous temperatures and pressures the metal pipes and vessels are all tremendously hot too. When turning the entire plant up or down you can't change the temperature inside too quickly or the metal will crack and you'll destroy your whole power plant. The metal needs to be given time to expand nice and slowly and evenly as you heat things up, and conversely needs to be given time to shrink back down nice and slowly as you cool things down. As you might imagine the more you have to cycle / turn on and off a power plant the faster all of this metal is going to wear out. Therefore when you take a coal plant (or a natural gas plant) offline, you have to keep burning coal (or natural gas) for a while to bring down the temperatures slowly. Conversely when you are going to turn on your Coal plant again you have to burn coal for a while to gently heat everything back up until its ready to go. The fastest a Coal plant can turn off and then back on again is around 5-6 hours. That said if the Coal plant has been off for say a week and is starting totally "cold" then stating up can take over 24 hours. Anyway, the key point here is that during these "warm up" and "cool down" periods coal is being burned but no electricity is being made. In other words, the more you have to cycle a coal plant, the more coal goes to waste. Just how big a problem this is in the grand scheme of things is a matter of debate, and I'll get into this in a later post, but there is no debate that less cycling is better than more if possible.
Finally the last thing to mention is actually the first thing on a grid operator's mind - the cost. If you remember that article from Arizona in the "Overview" post - turning off and then back on a single Natural Gas power plant just once costs approximately $60,000! For a single block in a single Coal plant it can be over $100,000! (Source: Western Wind and Solar Integration Study Phase 2, pg 11, figure 3(b)) No wonder utilities are loathe to cycle - they are businesses trying to make a profit. They make money by selling electricity. Cycling costs them a bunch of money, and what's worse during the time they turned their power plant off they're not even making any money because they're not making any electricity! Furthermore even a Coal block that is completely offline (turned off) isn't really ever all the way turned off - kind of like that little red light on your TV. But a really big little red light. According to a report by the IEA (see https://www.iea.org/ciab/papers/power_generation_from_coal.pdf - pages 20 and 55) an average offline Coal block still uses around 9% of the energy it would while running at full capacity. Add it all up and you have a fair amount of coal going to waste. Whew.
OK sorry about that - back to our graph. In fact here's our graph again (exactly the same as above):

OK so what is happening in the graph above is that we have a Coal plant with 4 blocks, and the grid operator shuts off (i.e. cycles or takes offline) 3 out of the 4 blocks. The first little red star at 9am is when they take those 3 blocks offline, and the second little red star at 3pm is when they bring those 3 blocks back online and reconnect them to the grid. Between 9am and 3pm, the remaining single coal block is able to turn down much lower than the 4 together, and voila! the Coal plant is able to turn down enough to accommodate the Solar power. The grid operator is pretty jittery though right around 9am and 3pm though. At 9am the 3 Coal blocks go offline, but right at that moment the Natural Gas plant is max'ed (see the circled number 1) and the single remaining Coal block is running at its max too (see the circled number 2). Then at 3pm the single Coal block has to run at its max once again. As you'll recall once a Coal block is taken offline it can't be brought back on again for 5-6 hours, which in our case leads to some tenuous moments for our grid operator's nerves. And more than that, it cost the utility running the Coal plant somewhere around $400,000. And more than that the coal burned while cooling down and then warming back up all went to waste.
Even if all of that didn't make total sense to you, hopefully you can see that as Solar electricity increases and increases grid operators are stuck choosing between two options, neither of which are very good. One is to simply curtail the electricity coming from the Solar plant, which is easy to do but as you can imagine doesn't go over to well with a lot of people. The other is to cycle their fossil fuel power plants (in our case coal) which loses them money, wears out their plants faster, and results in some percentage of coal being wasted anyway.
A better solution? I think you know the answer... energy storage!
In the next post we go through the same exercise but using a Summer demand curve instead.